
To get the most accurate assessment of your organisation’s performance, you need to pull all of the relevant information into one place. That’s where integrating Microsoft Power BI, Excel, and SharePoint Online will create a data management dream team. In this article, we’ll delve into how these three apps become a powerful collaboration tool that yields easy to read reports.
But first, let’s start with an explanation of the three apps.
Power BI – The Data Visualisation Wizard
Power BI (Business Intelligence) effortlessly inserts raw data into a user-friendly dashboard. A Power BI Report, complete with interactive dashboards (such as financial and specific project dashboards) allows users to drag-and-drop the information they need to get the most up-to-date results. But when you connect it with SharePoint Online, you can easily embed Power BI reports in your team sites, enhancing your navigation pane with insightful visuals. Draw data from local or cloud-based file servers and use the information to create reports that will help you drive success and create goals for your organisation.
How To Embed Reports In Team Sites
To create reports in Power BI that can be viewed by others on SharePoint, you will need a workspace to publish to, as well as a Power BI Pro license (at minimum).
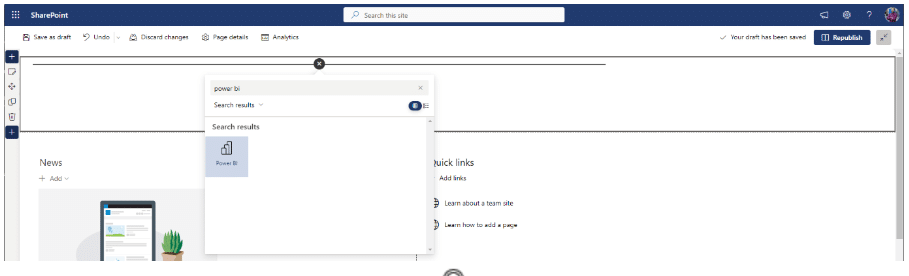
After publishing your report from Power BI Desktop to a workspace in Power BI Online, open the report from the workspace, click “File” -> “Embed report” -> “SharePoint online”, and copy the link provided.
But first, let’s start with an explanation of the three apps.

After creating a new modern page in SharePoint, edit the page to add a new web part and select Power BI. Once the webpart is added to the page, click the “Add report” button and paste the URL that you copied from your Power BI report into the report link box.
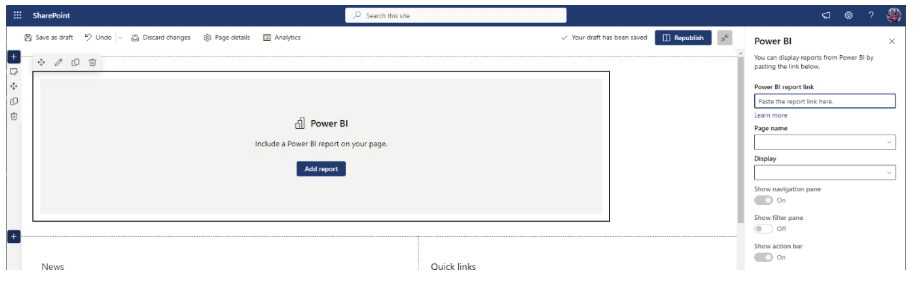
By default it will display the first page in the report, but you can change which page gets displayed first on the webpart as well as the aspect ratio, the navigation pane, filter pane, and action bar.
Once you are happy with the embedded report, click the “Publish” button to save your SharePoint page.
Excel – The Number Crunching Champion
We all know, and to varying degrees love Excel. Even if you spend half your life Googling how to find ‘sum of’, it continues to save the day with its number-crunching prowess. And with Power BI’s integration, you can export lists from SharePoint Online and seamlessly import them into Excel.
After navigating to the SharePoint list you wish to export, click the “Export” button in the bar above the list. Select “Export to CSV” or “Export to Excel” to export the SharePoint list content into an Excel format.
If you select “Export to Power BI”, this will build an automatic Power BI report based on the list data ready for you to publish to a Power BI Online workspace.
SharePoint Online – The Collaboration Maestro
SharePoint Online acts as the hub for collaboration, providing a secure environment for sharing data and documents. Its document library supports seamless version control, file backups, and folder paths.
How Do The Three Work Together?
- Excel data is stored in a SharePoint library to host the data and can be consumed as SharePoint in online storage. The data in the Excel workbook is imported into Power BI, where pages of visuals are built for users to read and slice and dice.
- The data is stored and maintained in a SharePoint list and is imported into Power BI where pages of visuals are built for users to read, and slice and dice. A mixture of both can also be done, reading from more than one Excel file and from more than one SharePoint list.
For example, a spreadsheet of an organisation’s HR department may wish to see visuals that show things like age, gender, salary brackets, FTE, etc. and want to be able to easily see the different views based on certain filters/slices:
Best Practices for a Superior Integration:
In Power BI, there are two main approaches for connecting to data sources and retrieving data: import and DirectQuery. Each approach has its own advantages and considerations based on your data and reporting needs.
1. Import:
Importing data in Power BI means that the data from your sources is loaded into Power BI’s internal data model. This data is stored within the Power BI file (PBIX) itself. When you import data, Power BI transforms and compresses it to optimise for performance. This approach is typically used when working with smaller datasets that can fit comfortably in memory.
Advantages:
- Faster performance: Data is loaded into memory, allowing for quick and responsive data exploration and visualisation.
- Offline access: Since the data is within the PBIX file, you can access and work on your reports even without a live connection to the data source.
- Enhanced modelling capabilities: You can perform data transformations, create calculated columns, measures, and relationships within Power BI’s built-in Power Query Editor and Data Modelling features.
Considerations:
- Data freshness: Import requires periodic data refreshes to keep the data up to date. Depending on the dataset’s size and frequency of updates, refresh times might vary.
- Data volume: Import might not be suitable for very large datasets that exceed the memory capacity of your machine or Power BI Service limitations.
2. DirectQuery:
DirectQuery is an alternative approach where Power BI sends queries directly to the data source in real-time without importing the data into Power BI’s internal model. This approach is often used when working with larger datasets or when the data needs to be always up to date.
Advantages:
- Live data: Since queries are sent to the source in real-time, you’re always working with the most up-to-date data.
- Large datasets: DirectQuery is suitable for scenarios where the dataset is too large to be imported into memory.
- Reduced storage requirements: You don’t need to store a copy of the data within the PBIX file.
Considerations:
- Performance: DirectQuery might result in slower performance compared to Import, especially for complex queries or slow data sources.
- Limited modelling capabilities: Some Power BI features are restricted when using DirectQuery. For example, certain transformations and calculated columns are done in the source database rather than within Power BI.
- Data source support: Not all data sources support DirectQuery, so compatibility should be checked.
Embrace the Future of Data Integration:
As the world of data integration continues to evolve, expect Microsoft to bring you more exciting features and integrations, enhancing your data management game.
With Power BI, Excel, SharePoint Online, and Office 365 by your side, you have a formidable team of data superheroes ready to unleash the full potential of your data. And if you’d like a tour of the Power Platform or Office 365 suite to discover how your business can benefit from better reporting, Propelle’s Microsoft specialists can help.
FAQs About Integrating Power BI, Excel, and SharePoint
Can I use Power BI without Excel or SharePoint?
Absolutely! Power BI is capable of transforming raw data into stunning reports and dashboards on its own, but the real magic happens when you integrate with Excel and SharePoint. By doing so, you open the door to a seamless data management dream team, where Excel’s number-crunching abilities and SharePoint’s collaboration features join forces with Power BI, providing an enhanced data analysis and collaboration experience.
Some examples of raw data that can be consumed in Power BI other than Excel are txt files, databases such as SQL and Oracle, cloud sources such as Azure blob and table storage, CMS applications such as D365, and also web API feeds such as XML and JSON through custom built connectors.
How often can I refresh data in Power BI?
You have the power to schedule data refresh as frequently as you need it. You can set the refresh frequency to match your business needs, whether it’s hourly, daily, weekly, or any other interval that suits your data requirements. This means you can keep your reports in sync, making sure that you and your team are always working with the most current and accurate data.
Is data collaboration safe in SharePoint?
Absolutely! SharePoint is a robust platform with a strong focus on security. You can trust SharePoint’s security measures to keep your data safe and secure, providing a reliable environment for data collaboration. SharePoint offers features such as version control, document libraries, and fine-grained access controls, ensuring that your data is protected and only accessible to authorised users. Whether you’re sharing files, collaborating on documents, or even embedding Power BI reports, SharePoint provides a secure and controlled space for team collaboration.
Can I share Power BI reports with team members who don’t have Power BI?
Yes, through SharePoint, you can share your Power BI reports with everyone in the team, regardless of whether they have the app. This is a fantastic feature for extending the reach of your data insights. By embedding BI reports in SharePoint, you can provide a limited experience to those who may not have licenses, but still want to benefit from the valuable information in your reports.
What’s next for data integration?
The future is indeed bright! Microsoft is continuously innovating to bring more exciting features and integrations to Power BI, Excel, and SharePoint. As the world of data management and business intelligence evolves, you can expect to see enhancements that further empower users to make informed decisions and streamline their data-related tasks. This continuous improvement ensures that you’ll have even more powerful tools at your disposal, enabling you to take your data management game to new heights.